⚲
No terms match your search. Try a different keyword.
The practice of planning and organizing people, infrastructure, communication, and material components to improve service quality and interaction between service provider and customers.
Service design makes invisible processes visible, so they can be analyzed, improved, and optimized for both customer experience and operational efficiency. It is less a single deliverable than a way of seeing: the discipline of treating a service as a designed object, with edges, parts, and decisions that can be drawn, debated, and reworked.
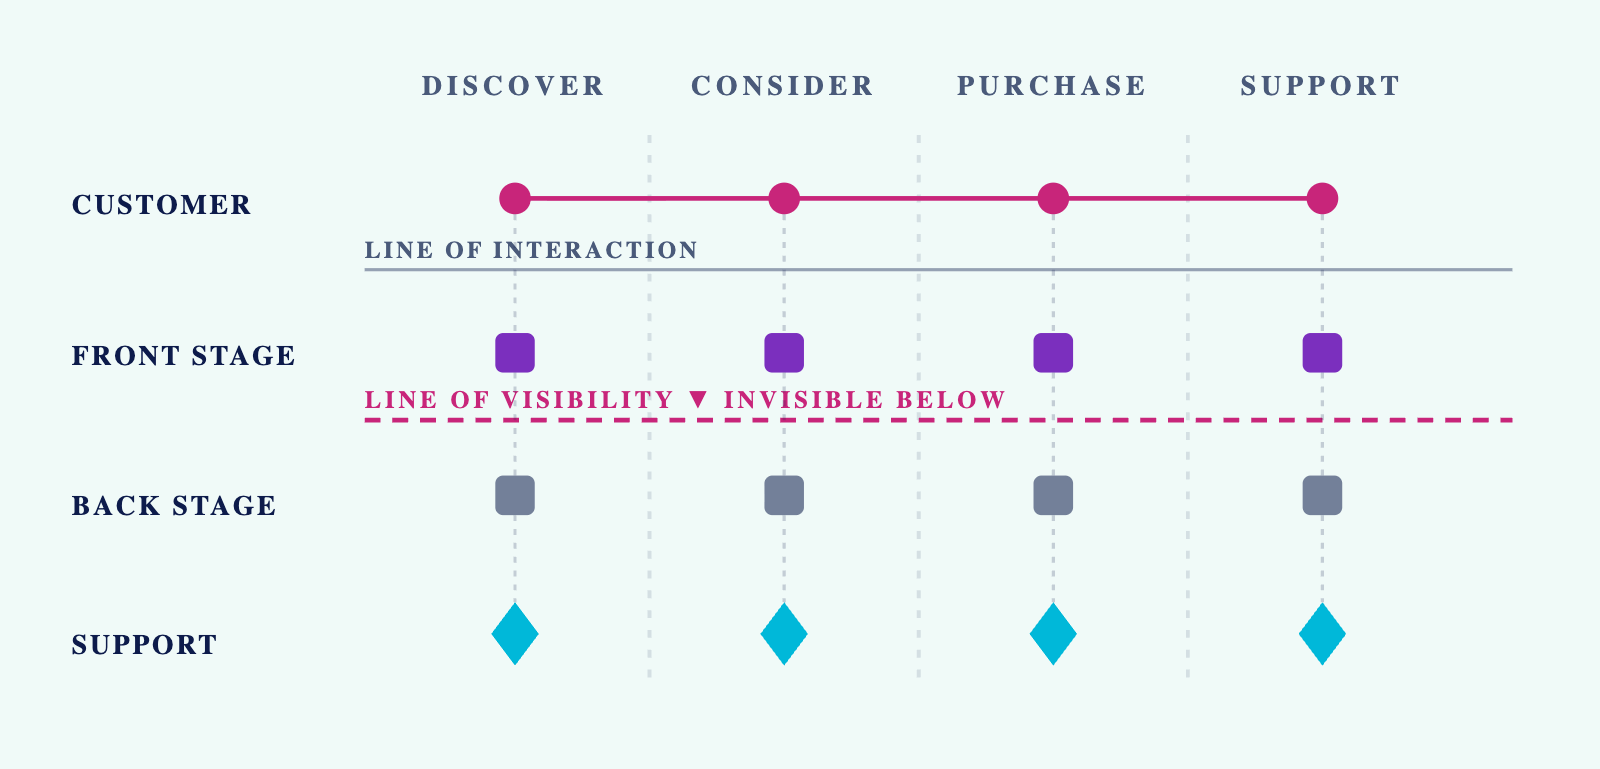
A SERVICE BLUEPRINT AT A GLANCE
A diagram visualizing the relationships between service components, tied to customer touchpoints. The single most useful artifact for surfacing hidden hand-offs and dependencies.
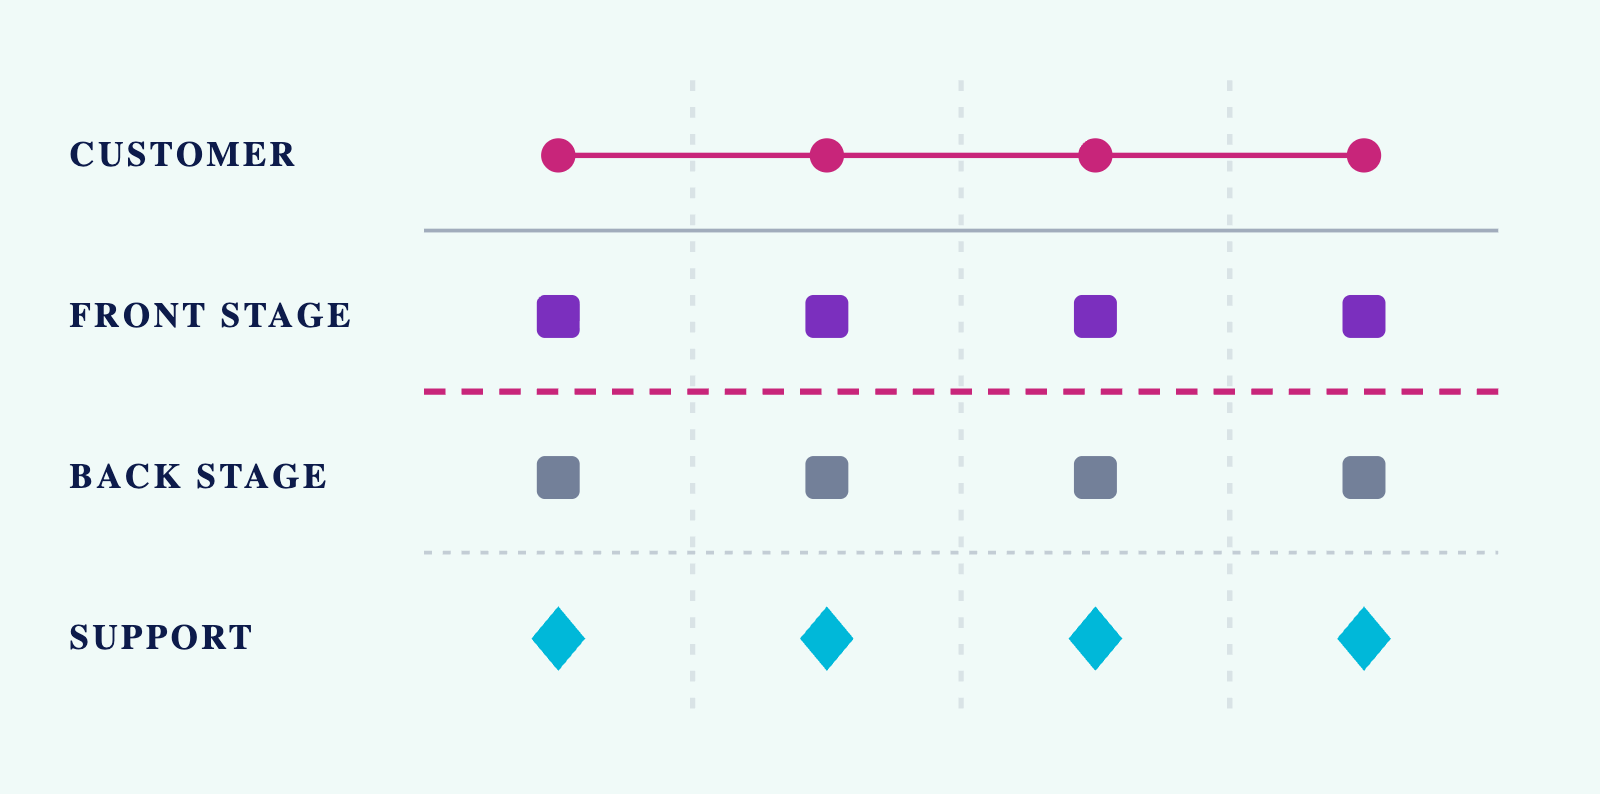
Horizontal chart showing customer actions, employee tasks, and supporting systems at each stage of the journey.
The complete sequence of experiences a customer goes through when interacting with a service.

Search → Reviews → Book → Arrive → Check out.
The time-based phases of customer experience, from awareness through post-experience.
Discovery → Research → Purchase → Delivery → Support → Renewal.
Any point of interaction between a customer and the service.
Website; email; phone call; physical location; social media; app.
Identifying and documenting all points where customers interact with your service.
Listing every channel: Instagram ad → Website → Email → Store visit.
The medium through which a customer interacts with a service or receives value.
Mobile app; in-store; phone; website; social DM.
Service delivery across multiple integrated channels with seamless transitions.
Start on app, continue on desktop, pick up in-store.
The full network of people, organizations, tech, and resources that make a service possible.
A clinic visit: patient, clinic, insurer, lab, pharmacy.
A fictional character representing a key customer segment, built from real research. Personas keep teams designing for someone specific instead of an abstract average.
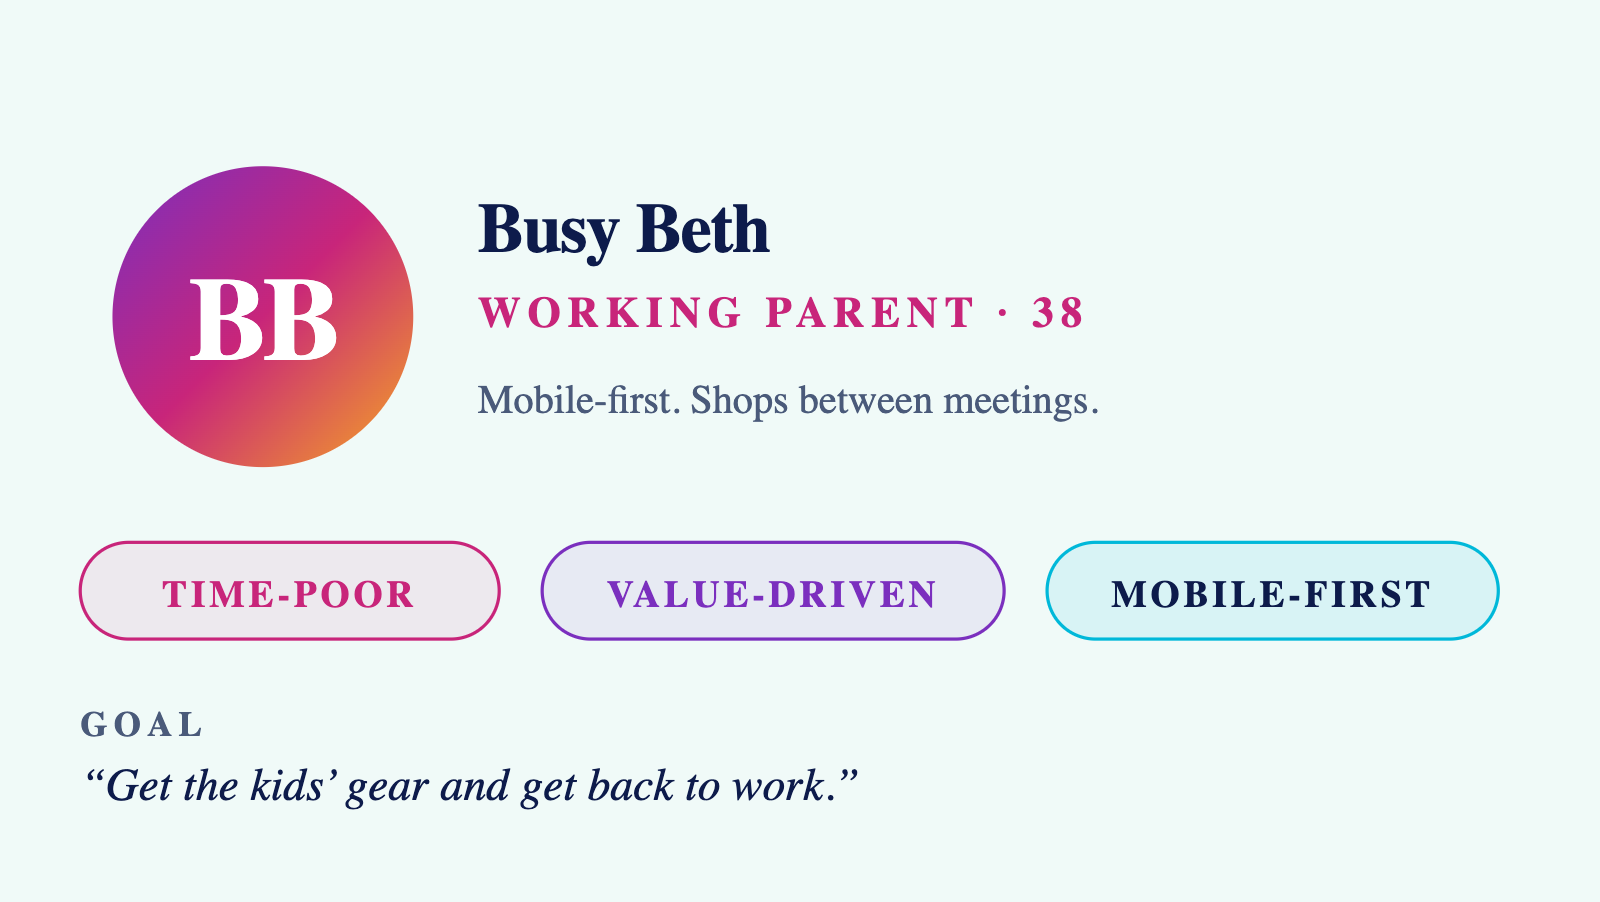
"Busy Beth": working parent, values speed, shops on mobile during her commute.
A tool for capturing what a customer says, thinks, does, and feels, to build deeper understanding.
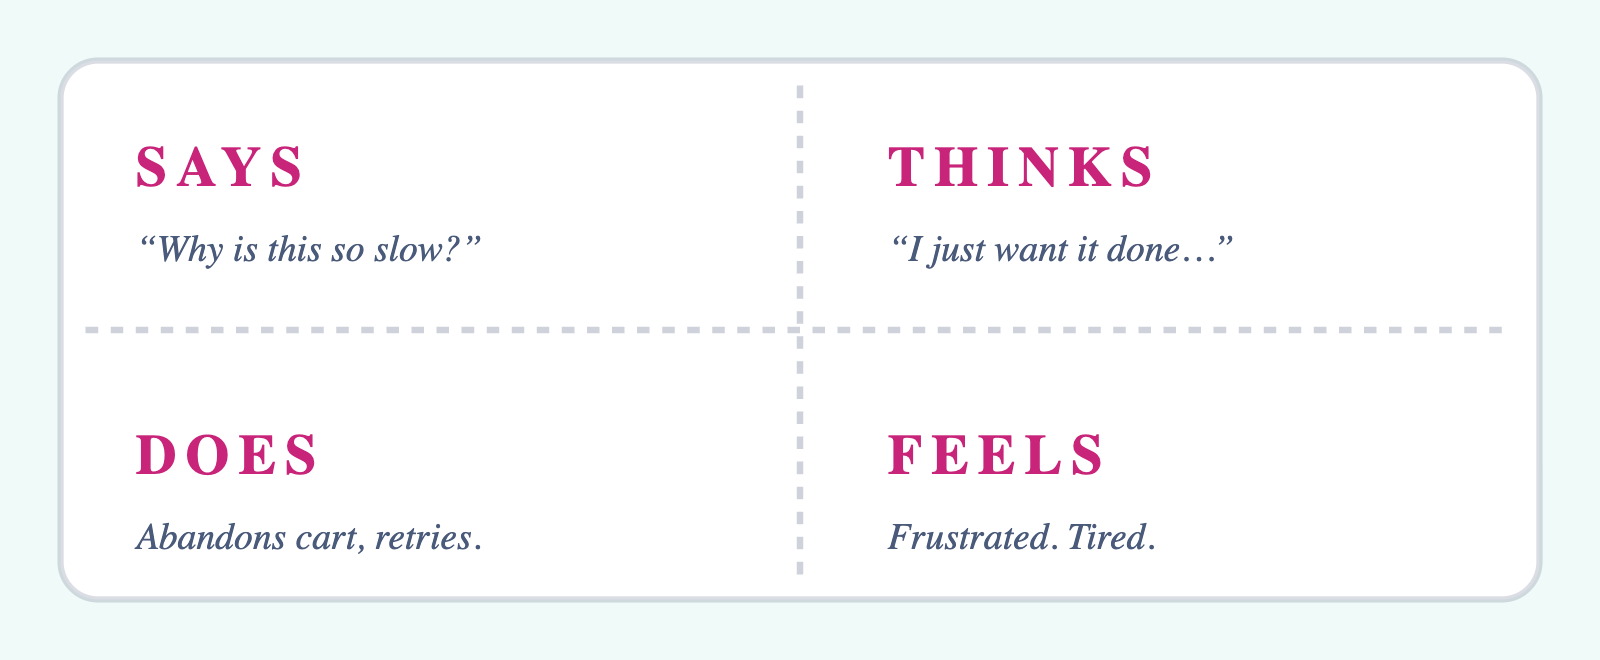
A four-quadrant canvas filled in from user interviews and observation.
A mapping of customer feelings and emotional states throughout their experience.
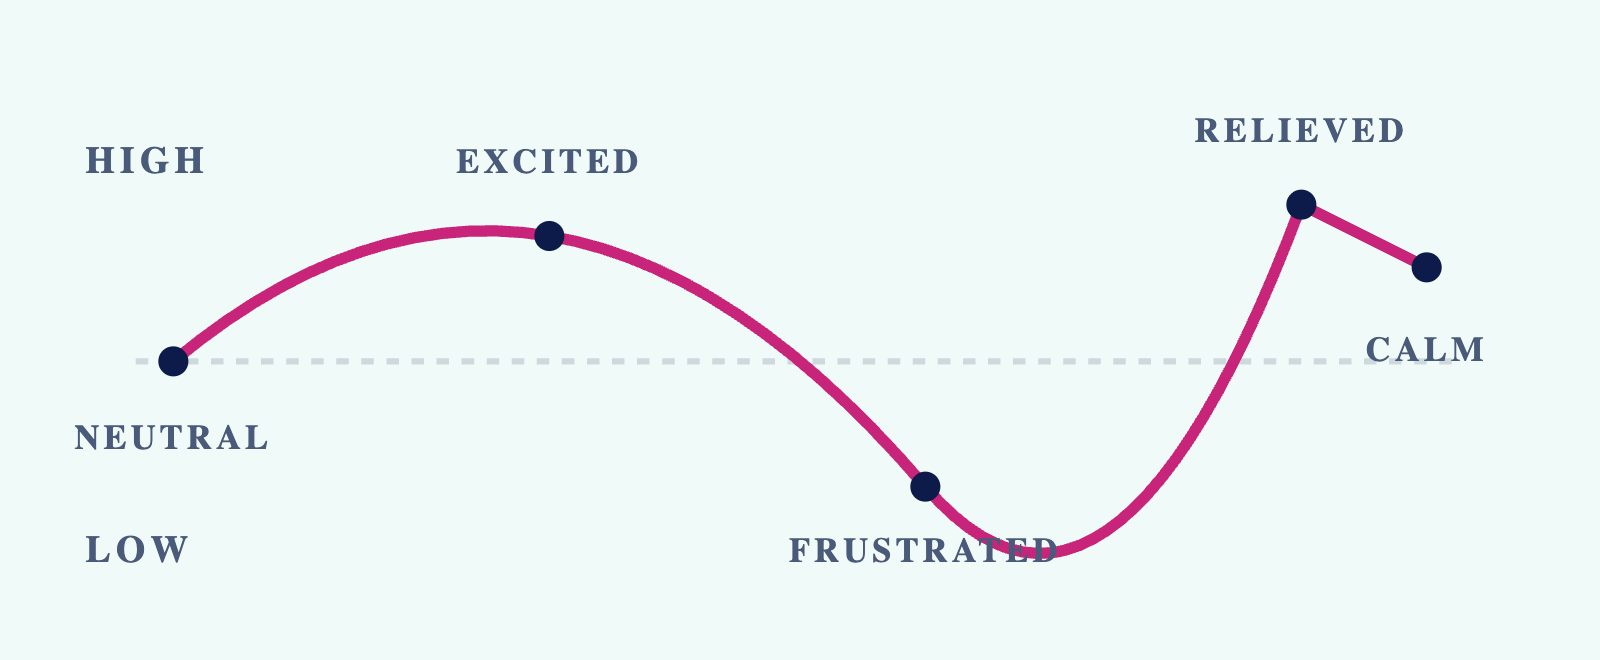
Anxious → Excited → Frustrated → Relieved → Calm.
A specific problem or frustration customers experience during their journey.
Confusing checkout flow; unclear pricing; no order tracking.
A critical interaction point that significantly impacts customer perception.
First impression entering a store; a support agent's initial response.
A short description of a feature or experience from the customer's perspective.
"As a new client, I want a checklist so I know what to expect."
Involving customers or stakeholders directly in designing the service experience.
Inviting beta users to shape features; participatory workshops.
Whether customers actually want the service, one leg of viability and feasibility.
Validating demand before building; confirming the problem is real.
Separates front stage (what customers see) from back stage (hidden operations). Drawing the line forces a team to ask: what does the customer actually witness right now?
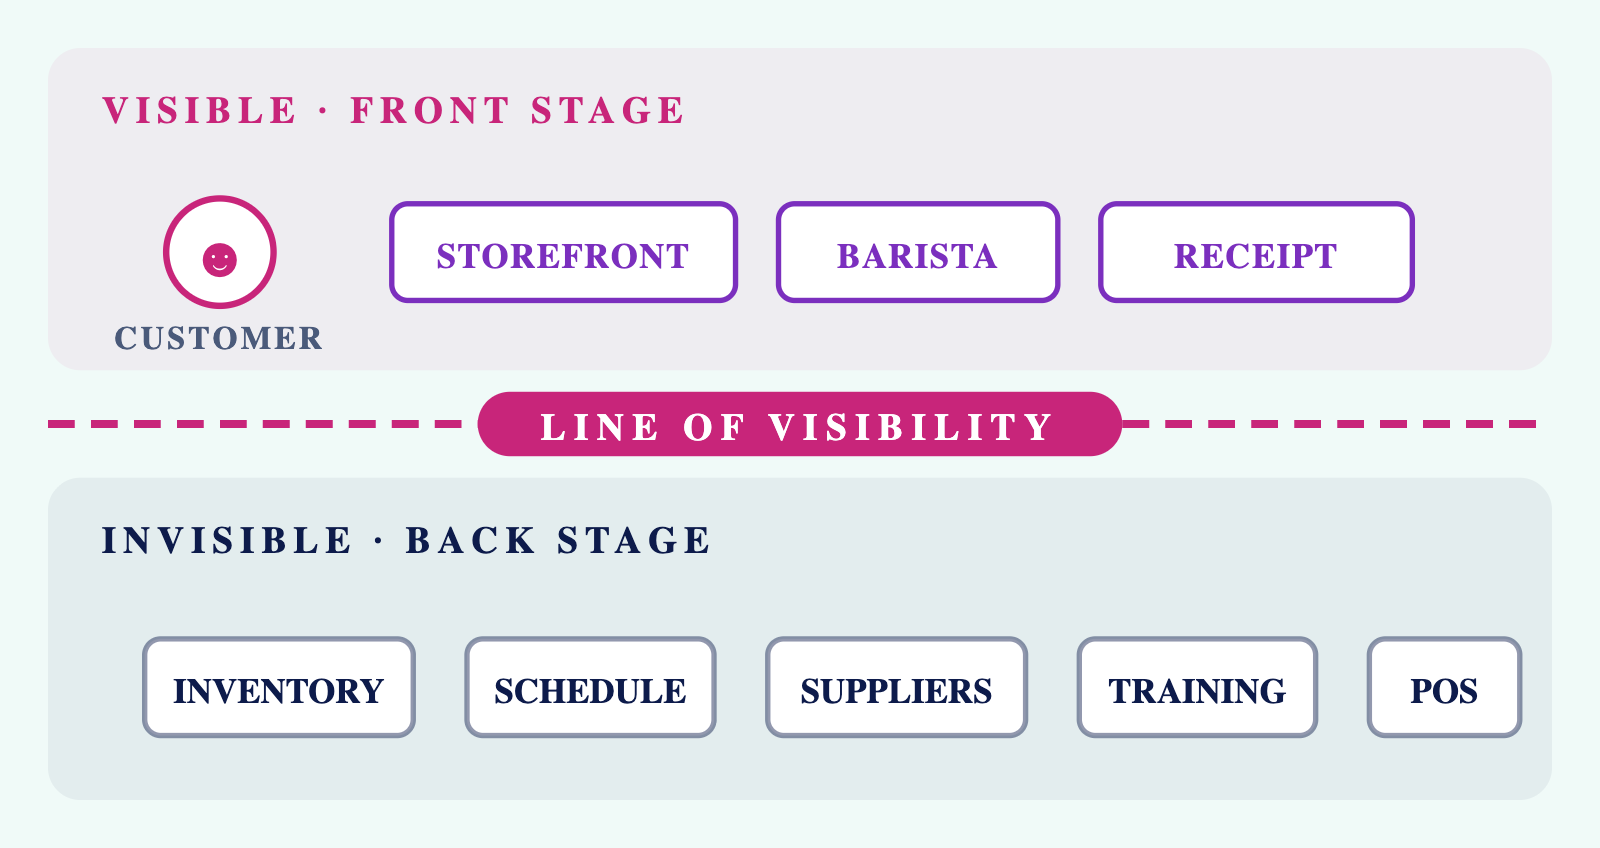
Barista makes coffee (visible) | Manager orders supplies (invisible).
Customer-facing aspects of service delivery that are visible and experienced directly.
Sales floor; customer service chat; website interface; reception desk.
Internal operations and employee actions invisible to customers but essential for service delivery.
Kitchen in a restaurant; warehouse fulfillment; payment processing.
Separates customer actions from service-provider actions in a blueprint.
Customer clicks "Submit" (above) → System processes order (below).
A horizontal row in a service blueprint representing a specific actor or system layer.
Customer row; front-stage staff row; back-stage ops row; tech row.
Technology, systems, policies, and infrastructure enabling service operations.
CRM database; payment gateway; inventory system.
Tangible or digital artifacts customers encounter during service delivery.
Website design; signage; packaging; receipts; branded emails.
The transfer of responsibility between people, departments, or systems.
Sales → Onboarding; Online order → Warehouse → Shipping.
A design process framework with two phases: discovering the right problem, then developing the right solution. Each diamond is a diverge-then-converge move.
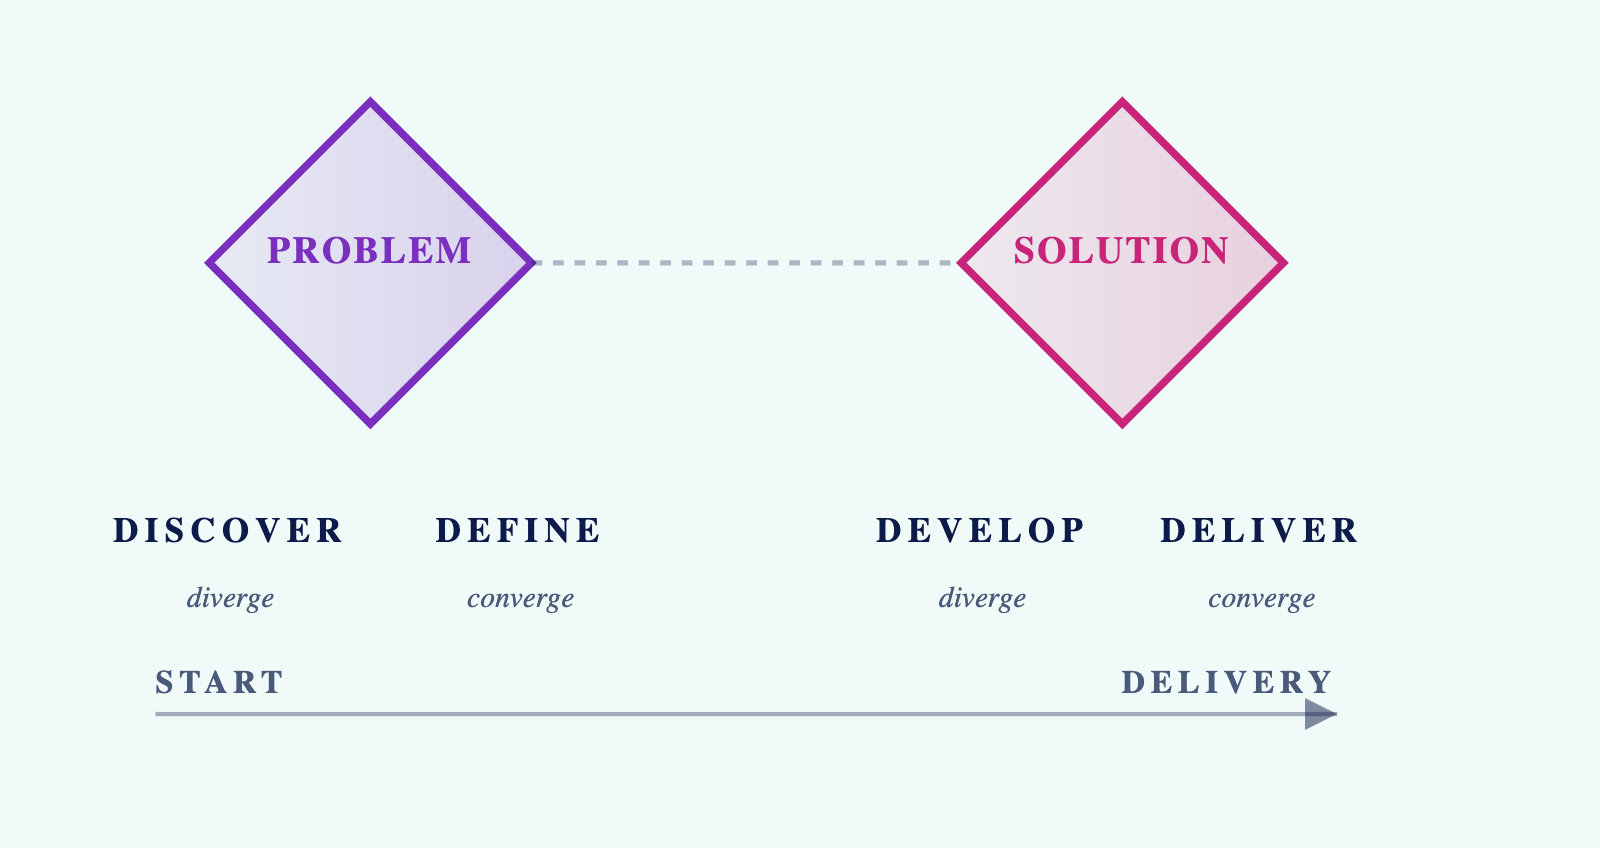
Phase 1: research and insight gathering. Phase 2: ideation and delivery.
A reframing technique that turns problems into open-ended design opportunities.
"Customers are confused at checkout" → "How might we make checkout feel effortless?"
An early model of a service concept used to test ideas before full development.
Paper mockup of a new intake form; role-played service walkthrough.
A point where customers make a choice that affects their subsequent path through the service.
Choosing delivery vs. pickup; selecting premium vs. basic plan.
A predefined process for responding when a service failure occurs.
A script for handling missed appointments; a refund policy for delayed delivery.
A verification moment to ensure service standards are met before proceeding.
Manager approves refund; QA reviews order before shipping.
A specific location in the service where things commonly go wrong.
Payment gateway timeout; missed reminder; long wait times.
A mechanism for capturing customer input and using it to improve service design.
Post-service survey; review requests; customer advisory boards.
A visual diagram of everyone who has a role in or is affected by a service, arranged by influence, proximity, or interest. Reveals dependencies that pure org charts hide.
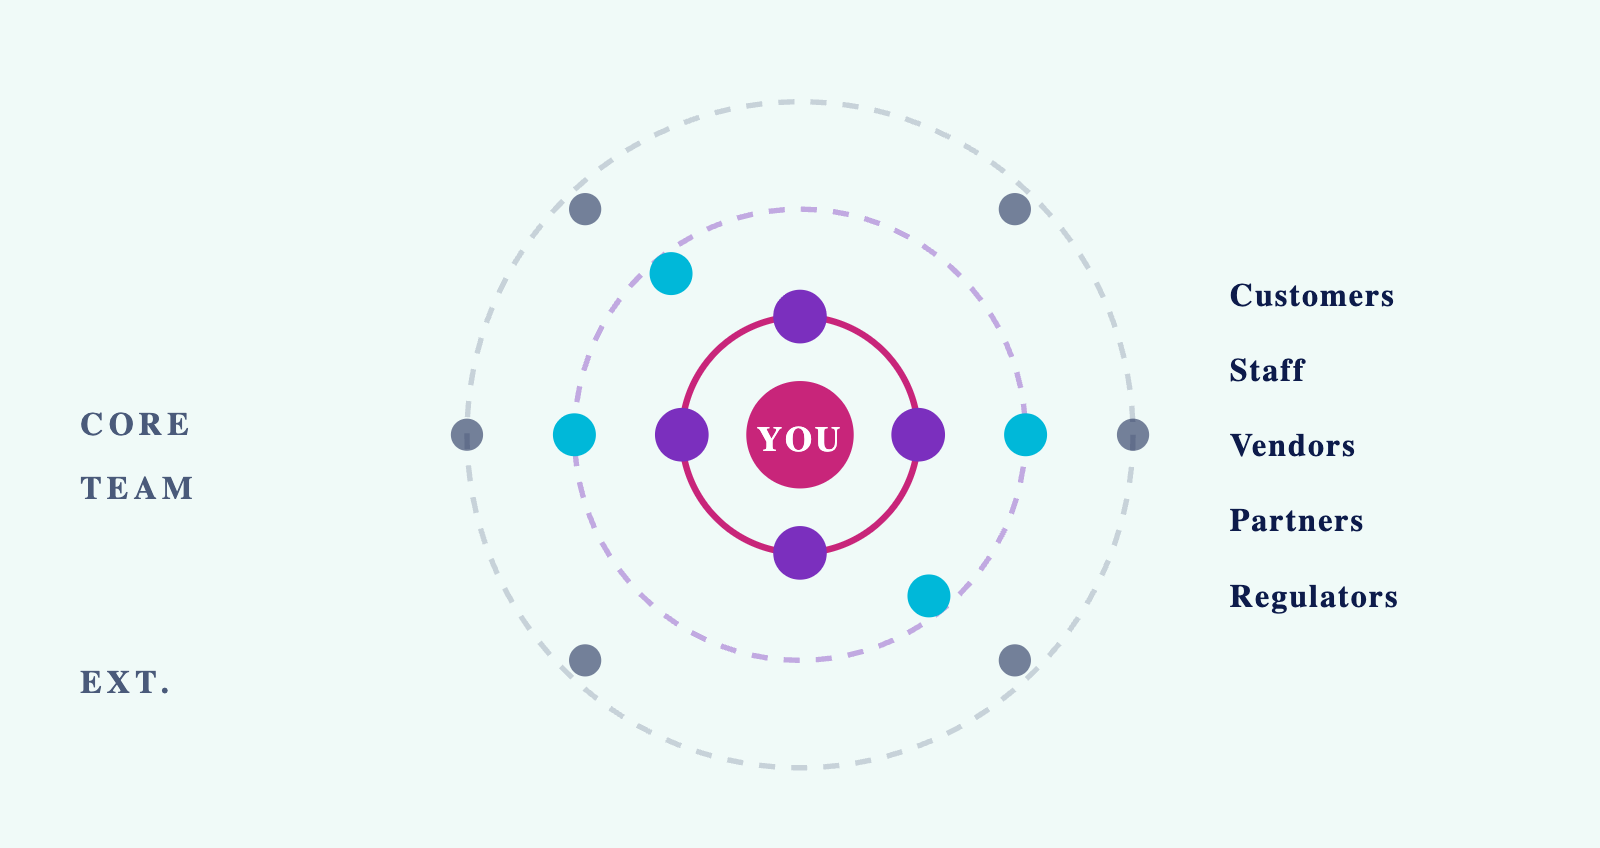
Founders, staff, clients, vendors, and partners mapped in concentric rings, closest first.
A measurable value demonstrating how effectively a service achieves its objectives.
Net Promoter Score; average resolution time; conversion rate.
A commitment defining expected service quality, including response times.
24-hour email response; 99.9% uptime; 30-day refund policy.
A loyalty metric based on customers' likelihood to recommend a service, scored 0–10.
9–10 = Promoter; 7–8 = Passive; 0–6 = Detractor.
A measure of how much work a customer must do to get an issue resolved or need met.
Rating how easy it was to return a product on a 1–7 scale.
The clear statement of how a service solves a problem and why customers should choose it.
"We turn invisible team problems into measurable results."
The invisible foundation behind outcomes: trust, culture, knowledge, relationships.
Staff expertise; brand reputation; client trust; institutional knowledge.
A process or task suitable for technology-based automation to improve efficiency or consistency.
Automated email confirmations; chatbot handling FAQs.
Ready to put the terms to work?
Map your own service with the Blueprint Generator, or go deeper with the free mini-course. Both are built for founders and operators, no account needed.